Comparative data myCount RiTa vs. manual counting
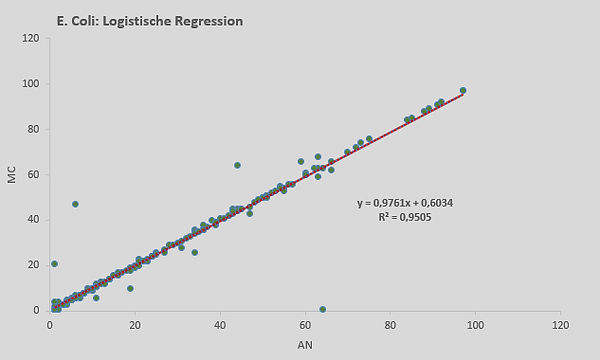
To prove the performance of the myCount iQT-Analyser RiTa, 271 positive Colilert-18® tests (121 Quanti-Tray®; 150 Quanti-Tray2000®) were collected after the automated analysis and immediately counted manually.
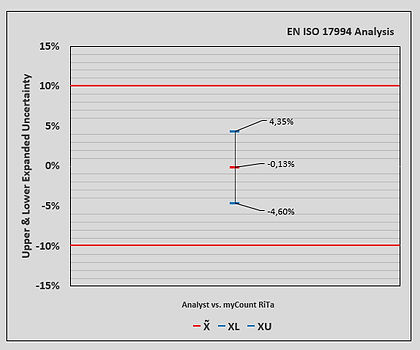
The counting results were compared using the statistical method described in EN ISO 17994:2014* and were subsequently subjected to a logistic regression.

Total coliforms
E. Coli
Fig. 1: EN ISO 17994:2014 diagram
Fig. 1 reveals that results from both methods only have a relative difference X of -0,32% (Coliforme) and -0,13% (E. Coli), respectively. According to ISO 17994:2014 both methods can be considered to be equivalent:
-10 % ≤ -1,49% ≤ 0 and 0 ≤ 0,85% ≤ +10 % (Coliforme) -10 % ≤ -4,60% ≤ 0 and 0 ≤ 4,35% ≤ +10 % (E. Coli)
X: Relative difference
XL: Lower expanded uncertainty
XU: Upper expanded uncertainty
* Water quality
Requirements for the comparison of the relative recovery of microorganisms by two quantitative methods (ISO 17994:2014)

Fig. 2: Logistic regression myCount RiTa (MC) vs. manual counting (AN)